
Accelerating climate transition through data and technology
Aligning with international standards, employing science-based approaches to assist in decision-making and operations, driving climate transformation through sustainable innovation.
Systems and automation - Establishing a financed carbon emissions management system
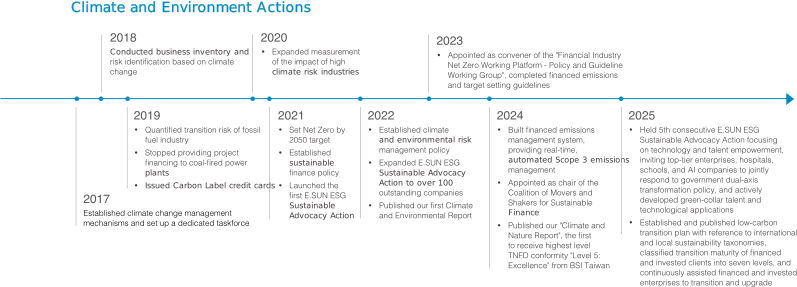
E.SUN established a standardized carbon inventory mechanism to manage carbon emission data in accordance with the PCAF Standard through its Financed Carbon Emissions Inventory Management System. With this system, we have increased the automation rate, improved efficiency, and reduced operational risks. Technology assists in the generation of financed carbon emission information and target management, enabling us to respond to potential risks and opportunities in real-time.

Enhancing climate risk management - Improving our physical risk database
The physical risks of climate change pose a significant challenge to the operational resilience of banks. In addition to the potential disruption of business operations, which may impact customer service and revenue, the depreciation of credit collateral value is also a major concern. To effectively manage climate-related physical risks, E.SUN has established an internal physical risk database that integrates with its business systems to provide decision-making information. We will continue to expand our collection of climate-related risk data in order to enhance the ability of frontline staff to identify physical risks.
Published Climate and Nature Report – First to Receive Third-party Verification for the TNFD Framework
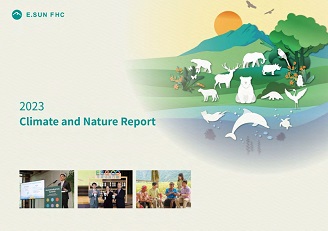
E.SUN released its “2023 Climate and Nature Report”, marking a significant milestone as the first report in Taiwan to receive third-party verification of the Taskforce on Nature-related Financial Disclosures (TNFD) framework. This report achieved the highest grade of “Level 5: Excellence” from the British Standards Institute (BSI) for TNFD conformity and “Level 5+: Excellence” for climate-related financial disclosures (TCFD). In early 2024, E.SUN joined the TNFD Early Adopters, committing to align with TNFD disclosure standards. The report uses the LEAP assessment approach and integrates international databases and localized data, including 51 operational characteristics and geospatial indicators, forming 31 data layers. Additionally, the report trials TNFD’s nature scenario analysis, assessing the impacts of biodiversity loss and water stress on E.SUN's investment and financing portfolio.
E.SUN Net Zero Actions and Transition Plan
E.SUN's Climate Transition Plan

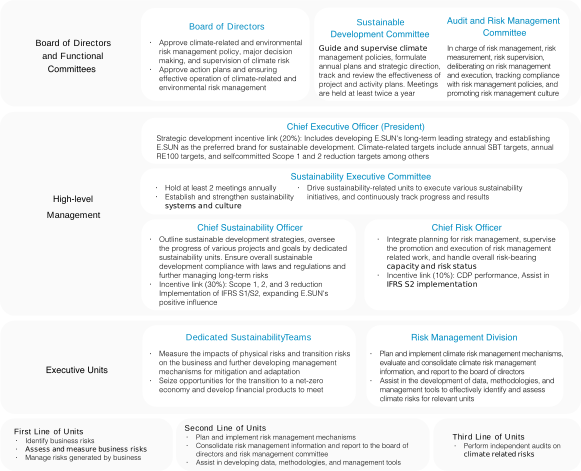
Climate and Environment Governance Structure
E.SUN Carbon Emissions Structure
E.SUN FHC GHG Emissions Timeline
Unit:t-CO2e
| 2021 | 2022 | 2023 | 2024 | 2025 | Third Party Verification | |
|---|---|---|---|---|---|---|
| Scope 1 | 1,857 | 1,844 | 2,161 | 2,403 | 1,893 | SGS Taiwan |
| Scope 2 | 22,105 | 20,294 | 17,959 | 10,291 | 10,317 | |
| Scope 3: Financed Emissions | 3,672,612 | 4,945,550 | 5,355,042 | 5,508,602 | 6,187,996 | PwC Taiwan |
| Scope 3: Others | 49,475 | 56,015 | 46,436 | 37,495 | 15,846 | SGS Taiwan |
| Total (Tons) | 3,746,049 | 5,023,703 | 5,421,598 | 5,558,791 | 6,216,052 |
Note: Scope 2 emission is calculated using market-based methods.
Scope 3 Portfolio Emissions Inventory
E.SUN FHC
Unit:t-CO2e
| 2021 | 2022 | 2023 | 2024 | 2025 | |
|---|---|---|---|---|---|
| Financed Emissions( t-CO2e) | 3,672,612 | 4,945,550 | 5,355,042 | 5,508,602 | 6,187,996 |
| Carbon Footprint (t-CO2e/$M) | 1.73 | 2.10 | 2.14 | 1.99 | 1.99 |
| Weighted Average Carbon Intensity (t-CO2e/$M) | 6.23 | 4.77 | 5.09 | 5.03 | 4.96 |
| Inventory Coverage (%) | 75.27% | 76.53% | 77.62% | 78.61% | 80.13% |
Subsidiaries
Unit:t-CO2e
| Bank | Securities | Venture Capital | Asset Management | |
|---|---|---|---|---|
| Financed Emissions( t-CO2e) | 6,180,213 | 3,759 | 4,024 | 0.18 |
| Carbon Footprint (t-CO2e/$M) | 1.99 | 1.20 | 0.81 | 0.02 |
| Weighted Average Carbon Intensity (t-CO2e/$M) | 4.97 | 2.44 | 2.67 | 0.32 |
Note 1: Emissions from investment and financing activities for 2025 have been estimated based on the changes in our total assets reported in our financial statements.
Note 2: Carbon Footprint = GHG emissions from investment and financing companies / inventoried balance of investment and financing companies
Note 3: The Weighted Average Carbon Intensity is calculated based on the carbon emissions per unit of revenue from the financed and invested entities, accounting for the proportion of E.SUN's financing and investment.
Note 4: Inventory Coverage = inventoried balance of investment and financing companies / sum of FVPL, FVOCI, AC, loans, and discounted items.
Note 5: Inventory coverage refers to the proportion of investment and financing activities that have been assessed in accordance with the PCAF methodology, relative to the total investment and financing portfolio. For 2025, E.SUN FHC's proportion of relevant investment and financing activities aligned with the PCAF methodology is 100%.
2025 Financed Carbon Emissions
E.SUN analyzes the GHG emissions of its investment and financing assets based on asset types, industry, and regions. We have set different decarbonization goals for different asset types according to SBT targets and plan control mechanisms for high-carbon industries. We also engage with customers and encourage staff to increase interaction with low-carbon companies or investment targets. We hope to leverage our financial influence to help achieve net-zero emissions.
Asset Class Distribution
| Asset Class Distribution | Financed Emissions (tCO2e) | Carbon Footprint (tCO2e/NT$1M) | WACI (tCO2e/ NT$1M) | Physical Emission Intensity2 | Physical Emission Intensity Unit2 | Data Quality | Inventory Coverage | ||
| Investments | Stocks and Corporate Bonds1 | 574,202 | 1.38 | 4.28 | - | - | 1.85 | 53.55% | |
| Sovereign Bonds | Excluding LULUCF | 1,613,584 | 6.51 | 6.51 | - | - | 1.00 | ||
| Including LULUCF | 1,443,891 | 5.83 | 5.83 | - | - | 1.00 | |||
| Crediting | Corporate Loans | 3,543,617 | 2.97 | 4.87 | - | - | 3.68 | 92.66% | |
| Power Generation Project Finance | 27,523 | 0.36 | - | 0.01 | tCO2e/Power Generated(MWh) | 3.01 | |||
| Commercial Real Estate Loans | 77,241 | 1.07 | - | 0.10 | tCO2e/Floor Area(m²) | 4.00 | |||
| Mortgages | 351,827 | 0.32 | - | 0.03 | tCO2e/Floor Area(m²) | 4.00 | |||
| Motor Vehicle Loans | - | - | - | - | tCO2e/km | - | |||
| Total | Excluding LULUCF | 6,187,996 | 1.99 | 4.96 | - | - | 3.32 | 80.13% | |
| Including LULUCF | 6,018,303 | 1.94 | 4.87 | 3.32 | |||||
Note 1: Due to PCAF 2nd Edition not yet having set guidelines for calculating Scope 3 GHG for sustainable bonds, such as green bonds, sustainability bonds, and social bonds, the carbon emissions from these types of bonds have been excluded from the investments in stocks and corporate bonds. The excluded emissions amount to 25,898 tCO2e. If the elements above are included, the overall inventory coverage will increase to 80.92%.
Note 2: Physical Emissions Intensity refers to the efficiency of total carbon emissions from specific activities within an industry per unit of output.
Geographical Distribution
| Geographical Distribution | Financed Emissions ( t-CO2e) |
Carbon Footprint (t-CO2e/$M) |
Weighted Average Carbon Intensity (t-CO2e/$M) |
|||||||||
| Bank | Securities | Venture Capital | Asset Management | Bank | Securities | Venture Capital | Asset Management | Bank | Securities | Venture Capital | Asset Management | |
| Taiwan | 3,236,331 | 3,213 | 3,635 | 0.18 | 1.51 | 1.43 | 0.98 | 0.02 | 2.27 | 3.04 | 2.65 | 0.32 |
| N. America & Europe | 1,387,975 | 541 | 0 | - | 2.89 | 0.69 | 0 | - | 3.13 | 1.01 | 0.32 | - |
| Hong Kong | 315,195 | - | - | - | 4.26 | - | - | - | 7.02 | - | - | - |
| Others | 408,718 | 5 | 389 | - | 2.08 | 0.05 | 0.31 | - | 5.20 | 0.19 | 2.73 | - |
| Other Asia | 830,520 | - | 0 | - | 4.12 | - | 0.04 | - | 6.38 | - | 0.36 | - |
| China | 1,475 | - | - | - | 0.54 | - | - | - | 0.91 | - | - | - |
| Total | 6,180,213 | 3,759 | 4,024 | 0.18 | 1.99 | 1.20 | 0.81 | 0.02 | 4.97 | 2.44 | 2.67 | 0.32 |
Industry distribution
| Industry Distribution | Financed Emissions ( t-CO2e) |
Carbon Footprint (t-CO2e/$M) |
Weighted Average Carbon Intensity (t-CO2e/$M) |
|||||||||
| Bank | Securities | Venture Capital | Asset Management | Bank | Securities | Venture Capital | Asset Management | Bank | Securities | Venture Capital | Asset Management | |
| Manufacturing | 979,193 | 209 | 1,642 | - | 4.36 | 0.67 | 0.83 | - | 4.71 | 1.28 | 3.72 | - |
| Electricity and Utilities | 389,935 | 10 | 3 | - | 3.82 | 0.49 | 2.05 | - | 49.04 | 1.98 | 1.98 | - |
| Fossil Fuels and Chemical | 409,960 | 6 | 95 | - | 7.32 | 1.66 | 1.29 | - | 10.86 | 6.06 | 5.56 | - |
| Transportation | 831,092 | 790 | 14 | - | 8.26 | 1.14 | 0.08 | - | 16.96 | 3.36 | 4.60 | - |
| Electronics | 416,982 | 2,022 | 1,925 | - | 2.89 | 2.16 | 2.35 | - | 3.04 | 4.04 | 3.72 | - |
| Others | 347,544 | 22 | 291 | - | 0.89 | 0.11 | 0.16 | - | 1.77 | 0.93 | 0.86 | - |
| Cement and Glass | 335,801 | - | - | - | 75.73 | - | - | - | 288.78 | - | - | - |
| Metals and Mining | 121,367 | - | - | - | 9.90 | - | - | - | 11.65 | - | - | - |
| Wholesale and Retail Trade | 196,739 | 212 | 54 | - | 0.92 | 0.64 | 0.55 | - | 0.58 | 1.04 | 0.64 | - |
| Finance | 141,658 | 17 | - | 0.18 | 0.29 | 0.03 | - | 0.02 | 0.72 | 0.11 | - | 0.32 |
| Total | 4,215,272 | 3,289 | 4,024 | 0.18 | 2.41 | 1.07 | 0.81 | 0.02 | 4.74 | 2.34 | 2.67 | 0.32 |
E.SUN Net Zero Actions and Transition Plan

Sustainable Operating Environment
Self-Operation Management
E.SUN has established specific goals, implementation measures, and management plans for environmental protection and energy conservation. Progress is regularly reported to and reviewed by senior management, and E.SUN actively promotes energy-saving and decarbonization initiatives to reduce greenhouse gas emissions resulting from energy consumption. Internally, E.SUN continues to advance environmental and energy-saving policies, promote environmental education, foster a culture of environmental protection and energy conservation, and implement related measures. Externally, E.SUN sets targets for carbon reduction, water reduction, and waste reduction in alignment with international benchmarks and initiatives such as DJBIC and CDP each year, and reviews progress toward these targets through annual third-party verification.
Sustainable Operating Environment Targets
- Based on the 2020 baseline, E.SUN aims to reduce its Scope 1 and 2 carbon emissions by 42% by the year 2030.
- Based on the 2020 baseline, E.SUN aims to reduce its Scope 3 carbon emissions from fuel- and energy-related activities by 42%by the year 2030.
- Based on the 2020 baseline, E.SUN aims to achieve 100% utilization of renewable energy for domestic locations by the year 2030.
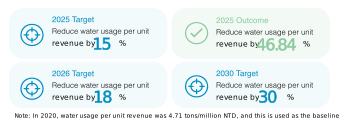
- Based on the 2020 baseline, E.SUN aims to reduce its water usage for revenue generation by 30% by the year 2030.
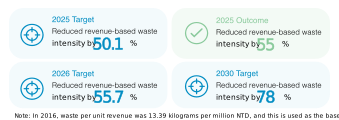
- Based on the 2016 baseline, E.SUN aims to reduce its waste generation for revenue generation by 78% by the year 2030.
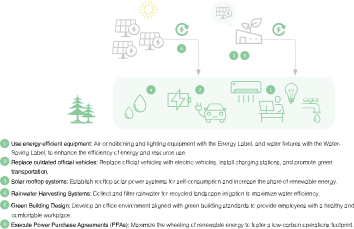
Green Operations Framework Diagram
Carbon reduction measures
Implement Scope 1 & Scope 2 internal carbon pricing
In an era of accelerating growth and maturation in global carbon markets, E.SUN began planning and implementing an internal carbon pricing mechanism for Scope 1 and Scope 2 emissions in 2023. We initially established a carbon price and incorporated the carbon fee concept into energy-saving benefit assessments, and we conduct greenhouse gas inventories to analyze emissions and associated carbon-cost information by unit. In 2024, we promoted internal carbon pricing across all domestic banking locations, integrating carbon costs into routine operations so that business units recognize emissions as a cost, thereby guiding departments to establish and implement carbon-emissions management measures.
Promoting the Use of Renewable Energy
E.SUN FHC is committed to sourcing 100% renewable energy at all domestic and international locations by 2040. To advance this objective, E.SUN Bank completed the installation of solar panels on all domestically owned buildings in 2025; concurrently, subsidiary E.SUN securities began procuring renewable electricity from January 2025. In 2025, our overall share of renewable energy usage reached 55.97%, demonstrating our continued determination toward Achieving net zero emissions by 2050.
Learn more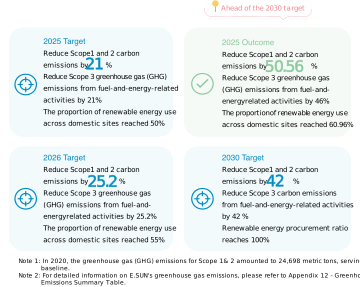
Water Usage Reduction
E.SUN introduced the ISO 46001 Water Efficiency Management System in 2021 and conducted an in-depth review of water usage improvement measures across its branches within the framework of water footprint assessment. Moving forward, it will use the company's annual water consumption as the benchmark to continuously expand the scope of management and implement various measures to reduce water usage and wastewater discharge.
Waste Usage Reduction
E.SUN Bank actively selects eco-friendly materials, aiming to minimize environmental impact and promote environmental awareness throughout society. We strive to a sustainable future with the spirit of "One love leads to more love,"making every effort to create a more sustainable future.